Description: Online course "How to make money in China"
Geo: Europe
Niche: Online courses
AOV: $450
Budget: $30 000/2 months
ROAS: x5,17
Revenue: $156 000

Client’s background
Sales funnel structure:
The whole funnel is based on free auto webinars, which are held every day. After viewing the webinar, a sales representative contacts the customer and offers to purchase the full course. Also, there is an e-mail newsletter and chatbots are offered after registering for the webinar.
Client’s goal:
- KPI for free registration up to $3
- ROAS x2 for the first work month
- Monthly budget - $15,000
Experience with paid traffic:
When we first opened the client's Facebook advertising account, we saw many ad campaigns with different objectives, with daily budgets ranging from $1 to $50 a day, dozens of different audiences, in a word – chaos. The average price for registration was $4, also Pixel was set up incorrectly and occasionally duplicated events. There was no campaign structure whatsoever.
How we fixed the duplication of GetCourse events?
First of all, we did the Facebook pixel set-up. The site was made on Tilda, but the feedback forms were set up via GetCourse. Therefore, the standard tracking of successful form submission via Google Tag Manager didn't work correctly. The Registration Completed event was set up by inserting code into the GetCourse form, thus making the difference between the actual data and the data in the account almost nil.
The site is a simple landing page with a single feedback form, which performs only 2 functions:
- Warming up the customer and giving more information about the product
- Collecting contacts for feedback and invitations to a free webinar
Therefore, we did not set up any more events, custom scripts, etc., as this was not necessary in this case
First-month tests
Many tests were carried out in the first working month, namely:
- Audiences
- Types of creatives
- Placements
- Types of ads campaign structure
Initially 1 conversion campaign was launched with 6 different ad sets and automatic placements. The campaign included static banners, carousels and talking videos with animations. Then appeared new hypotheses and ideas, new campaign structures, audiences and offers. In total, 10 audiences were tested in a month of work:
-
- Broad
- LAL who bought the course
- LAL engaged in Instagram.
- LAL from an old event Lead, created by a previous specialist
- LAL from our Registration Completed event
- Interests Business
- Interests Mothers
- Interests Online education
- Interests E-comm
- Interests Shopping
Many of these audiences were tested with narrowing, for example, Shopping narrowed to Engaged shoppers or Mothers narrowed to Online education.
Retarget was also tested on small budgets ($2-5 per day) but it showed no results and was switched off.
The test for each “audience+placement+creativeset” lasted 3-4 days and due to the available monthly budget, we could afford to test several hypotheses at the same time.
In addition to tests of audiences and type of creative, there were also tests of offers, ranging from the most "screaming" ones ("Do you want to earn 1,000,000 rubles in 1 month?") to detailed descriptions of real cases of people who had already completed the course.
Based on the results of the test month, we identified the best audiences, placements, creatives also developed the structure of the advertising campaign and were ready for the “rubbish removal”.
What came out of the tests?
Audiences
The three best audiences were selected after the tests, namely:
- Interests Business (approximately 7 300 000)
- Broad (approximately 21 000 000)
- LAL 1-5% who bought the course (approximately 1 300 000)
These audiences showed the best price per registration over the entire test period.
LAL audience was created from the client database, which was updated every 2 weeks. Accordingly, the LAL audience was also updating, and the frequency of impressions remained within the norm
Advertising creatives
The best results among the creatives were:
- Static banners
- Carousels: static banner + feedback
- Talking videos
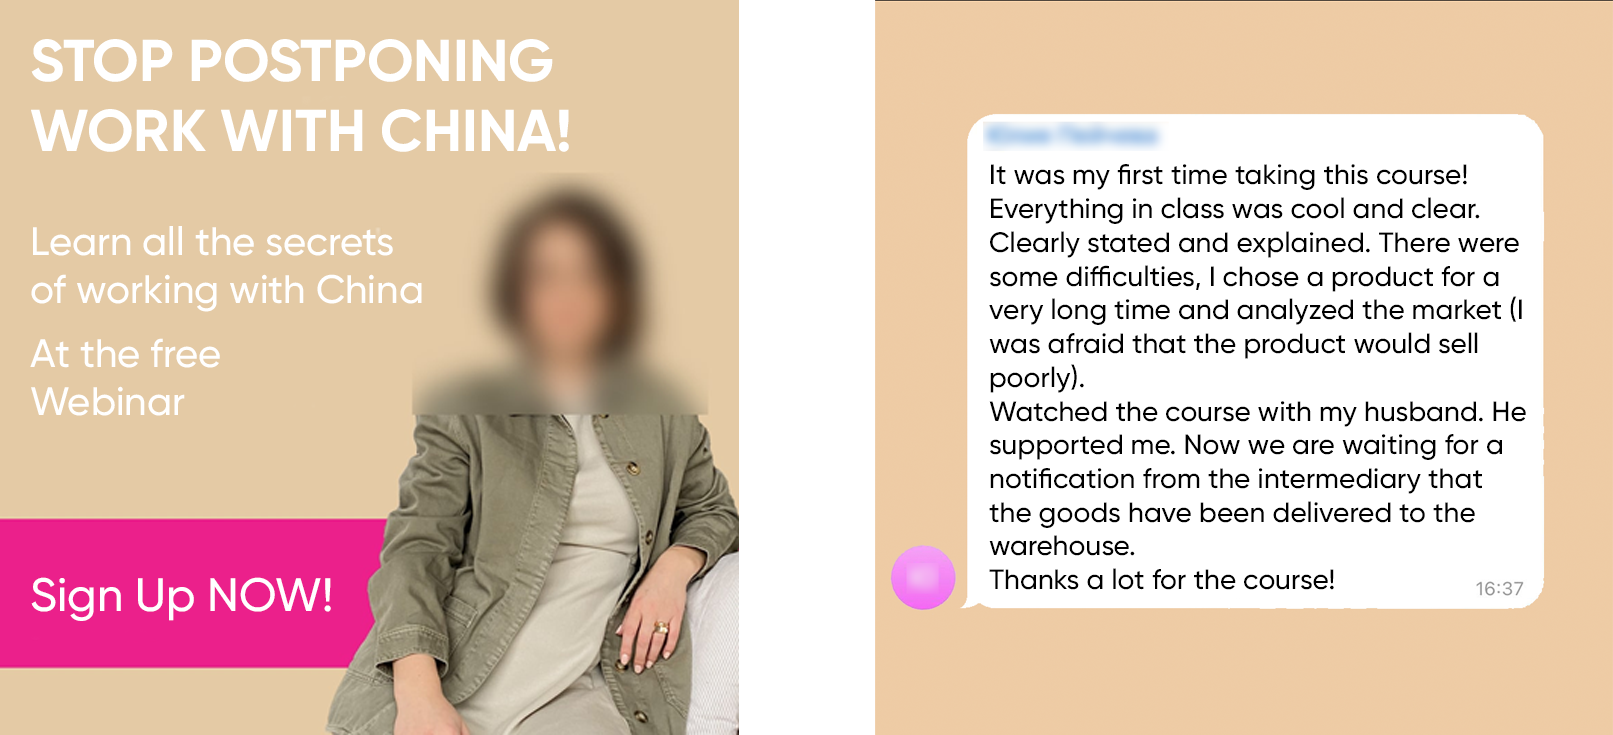
Also noteworthy are the case study descriptions in the carousel: the first photo is a banner with the student and the next photo shows the result (the student's income in China after completing the course) over a certain period.
Successful creative examples (The face is blurred at the client request):

Does copywriting matter?
It would seem who reads the text of an advertisement? It must be that users see the picture, read the headline at best then go to the landing page and get acquainted with the product/service. That's why nothing more than attractive headlines, short lists of benefits, action calls or abbreviated descriptions of product features are mostly used.
Although we were also very sceptical about writing longreads for Facebook and Instagram ad campaigns but we decided to test it anyway. A lot of effort and energy was expended, but it paid off - as a result, the price for registering for a free webinar fell by 15% on longread ads, while the people reached per webinar rose by 5%.
Advertising campaign structure
Advertising creatives - Done ✅
Audiences - Done ✅
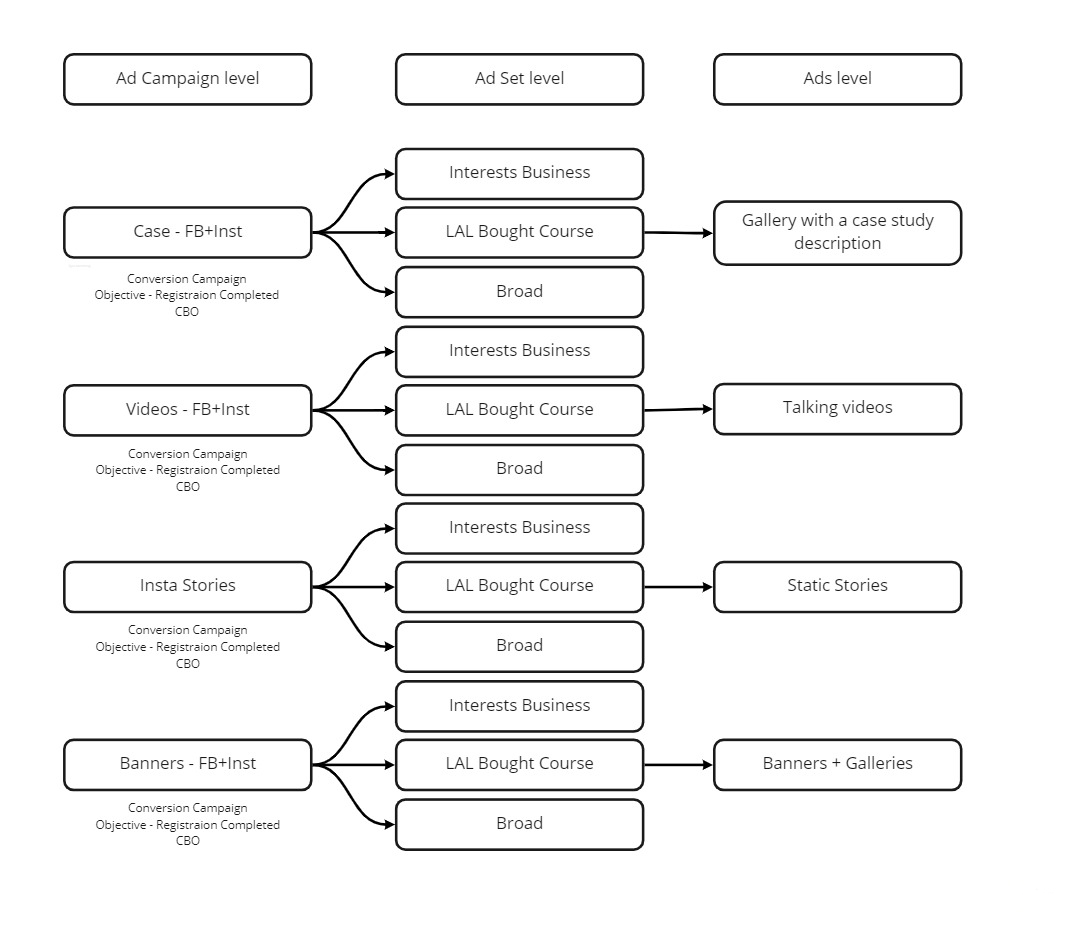
It remained to develop the advertising campaign structure. We decided to divide the campaigns into placements, offers and types of creatives accordingly, i.e:
- Ad campaign with case studies (Feed and Stories Facebook + Instagram)
- Ad campaign with talking videos (Feed and Stories Facebook + Instagram)
- Ad campaign for Instagram Stories only
- Ad campaign with static banners (Feed and Stories Facebook + Instagram)
3 groups of ads were created in each campaign with the above-described audiences and CBO.
Reporting and feedback
It was decided to keep a daily reporting table with all the figures we need for end-to-end analytics since webinar registration was only the first stage of the funnel and Facebook did not receive sales data. The client's IT manager filled in the data from GetCourse and we in turn entered data from Facebook analytics daily. The table contains the following metrics:
- Spent budget
- Number of registrations for the free webinar
- Cost per registration
- Number of the landing page views
- Website conversion
- Number of webinar participants and percentage of reached people
- Number of leads, cost per lead and conversion from webinar viewers to leads
- Number of sales and their amount, conversion from lead to sales
- ROMI
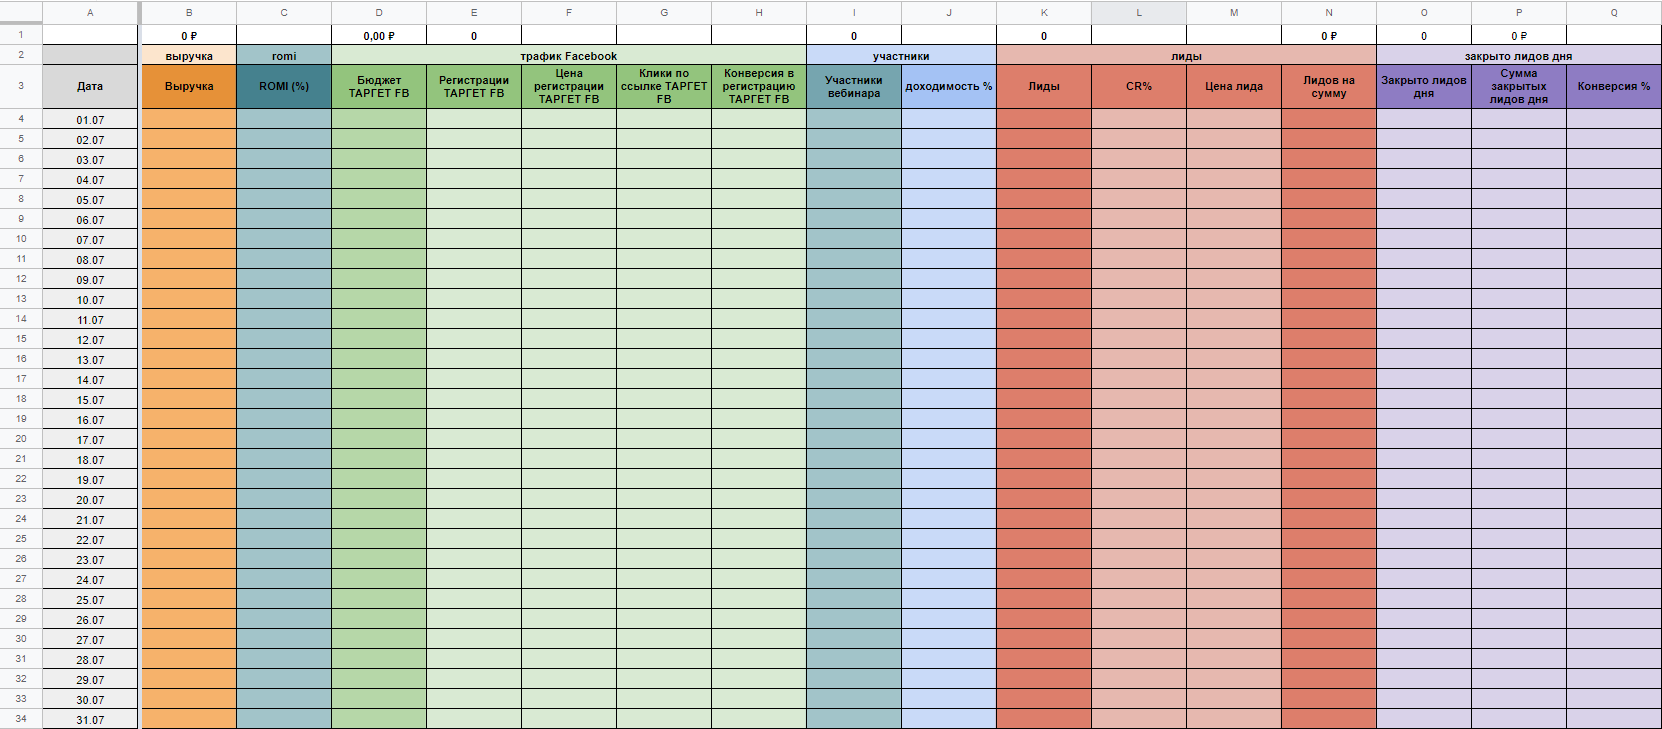
With this reporting system, we are able to conduct a daily, end-to-end funnel analysis, monitor KPIs and in case of a slump, quickly find a problem and fix it.
Scaling plans
Certainly, this is not the end of the work. At the moment, we are gradually increasing the advertising budget of the current campaigns and are discussing different options with the client to scale out. For example, such as entering new markets (Ukraine + the Baltics), expanding the service matrix and testing other traffic channels (VKontakte, Tik-Tok, Google Ads). We have also started working on growing the blog on Instargam with targeted advertising.
Result
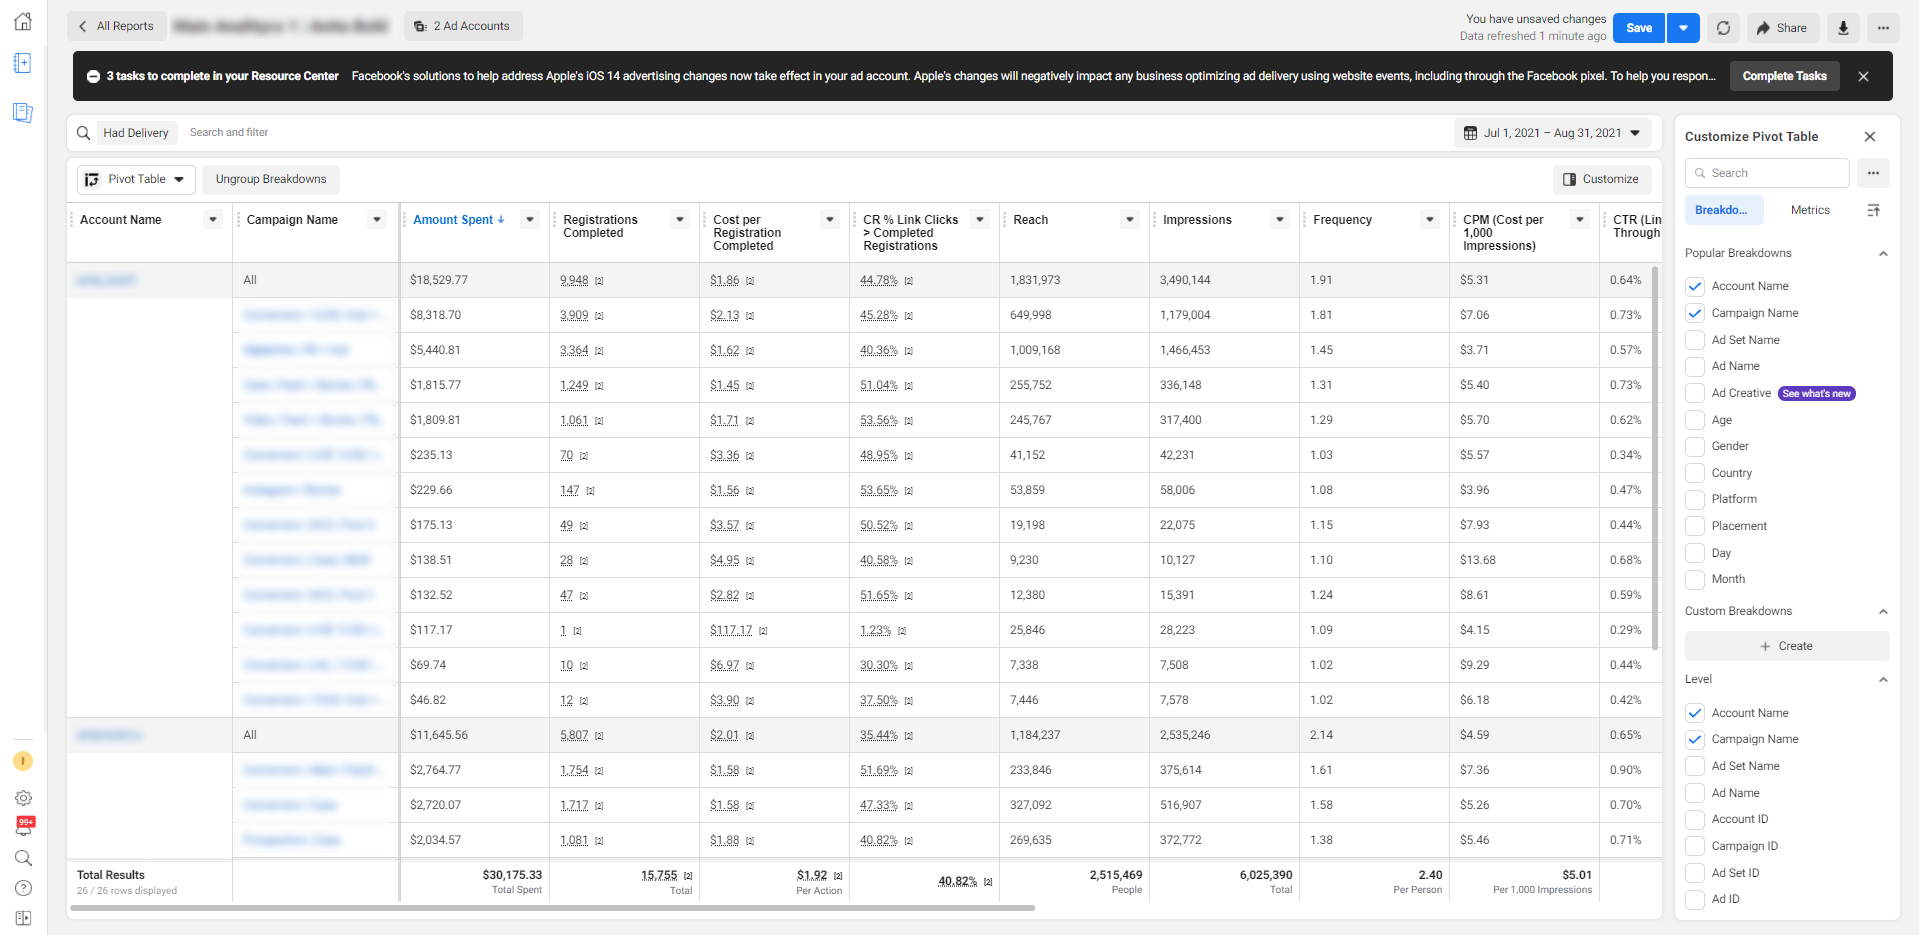
✅ ROMI = 5.17 in 2 months
✅ $156 006 - 2 months' revenue
✅ Created a campaign structure that is easy to analyse and scale
✅ Work on scaling has started
✅ Work on growing the Instagram blog has begun
ROMI and revenue data provided from client reports
The screenshot shows the data for 2 working months. A few advertising accounts were used in the process.
Project Team
Get started on the project
A great way to start getting to know your business - just to call. Leave a form, and we will delve into your enterprise challenges and offer the best solutions.